Photo by Anthony Fomin.
Citi Bike: Challenges of Expansion (Part 1 of 2)
Introduction
In November 2018, Lyft (who acquired Motivate, the Citi Bike operator) announced an ambitious expansion of Citi Bike’s service, aiming to double its existing service area and more than tripling the bicycle fleet to 40,000 over the next five years. This bold move would make Citi Bike one of the largest bicycle sharing systems in the world and put it on a solid footing for an eventual expansion to all the five boroughs.
Such an ambitious plan does not come without risks, especially in a city as diverse and dynamic as New York City. In this post, I analyse Citi Bike’s current performance through four main lenses: ridership numbers, trip duration and frequencies, weather, and bicycle counts. These were chosen to provide a general understanding of how Citi Bikes has been performing thus far in New York City. The next post will focus on broader strategic challenges to Citi Bike’s expansion plans.
1. Ridership numbers
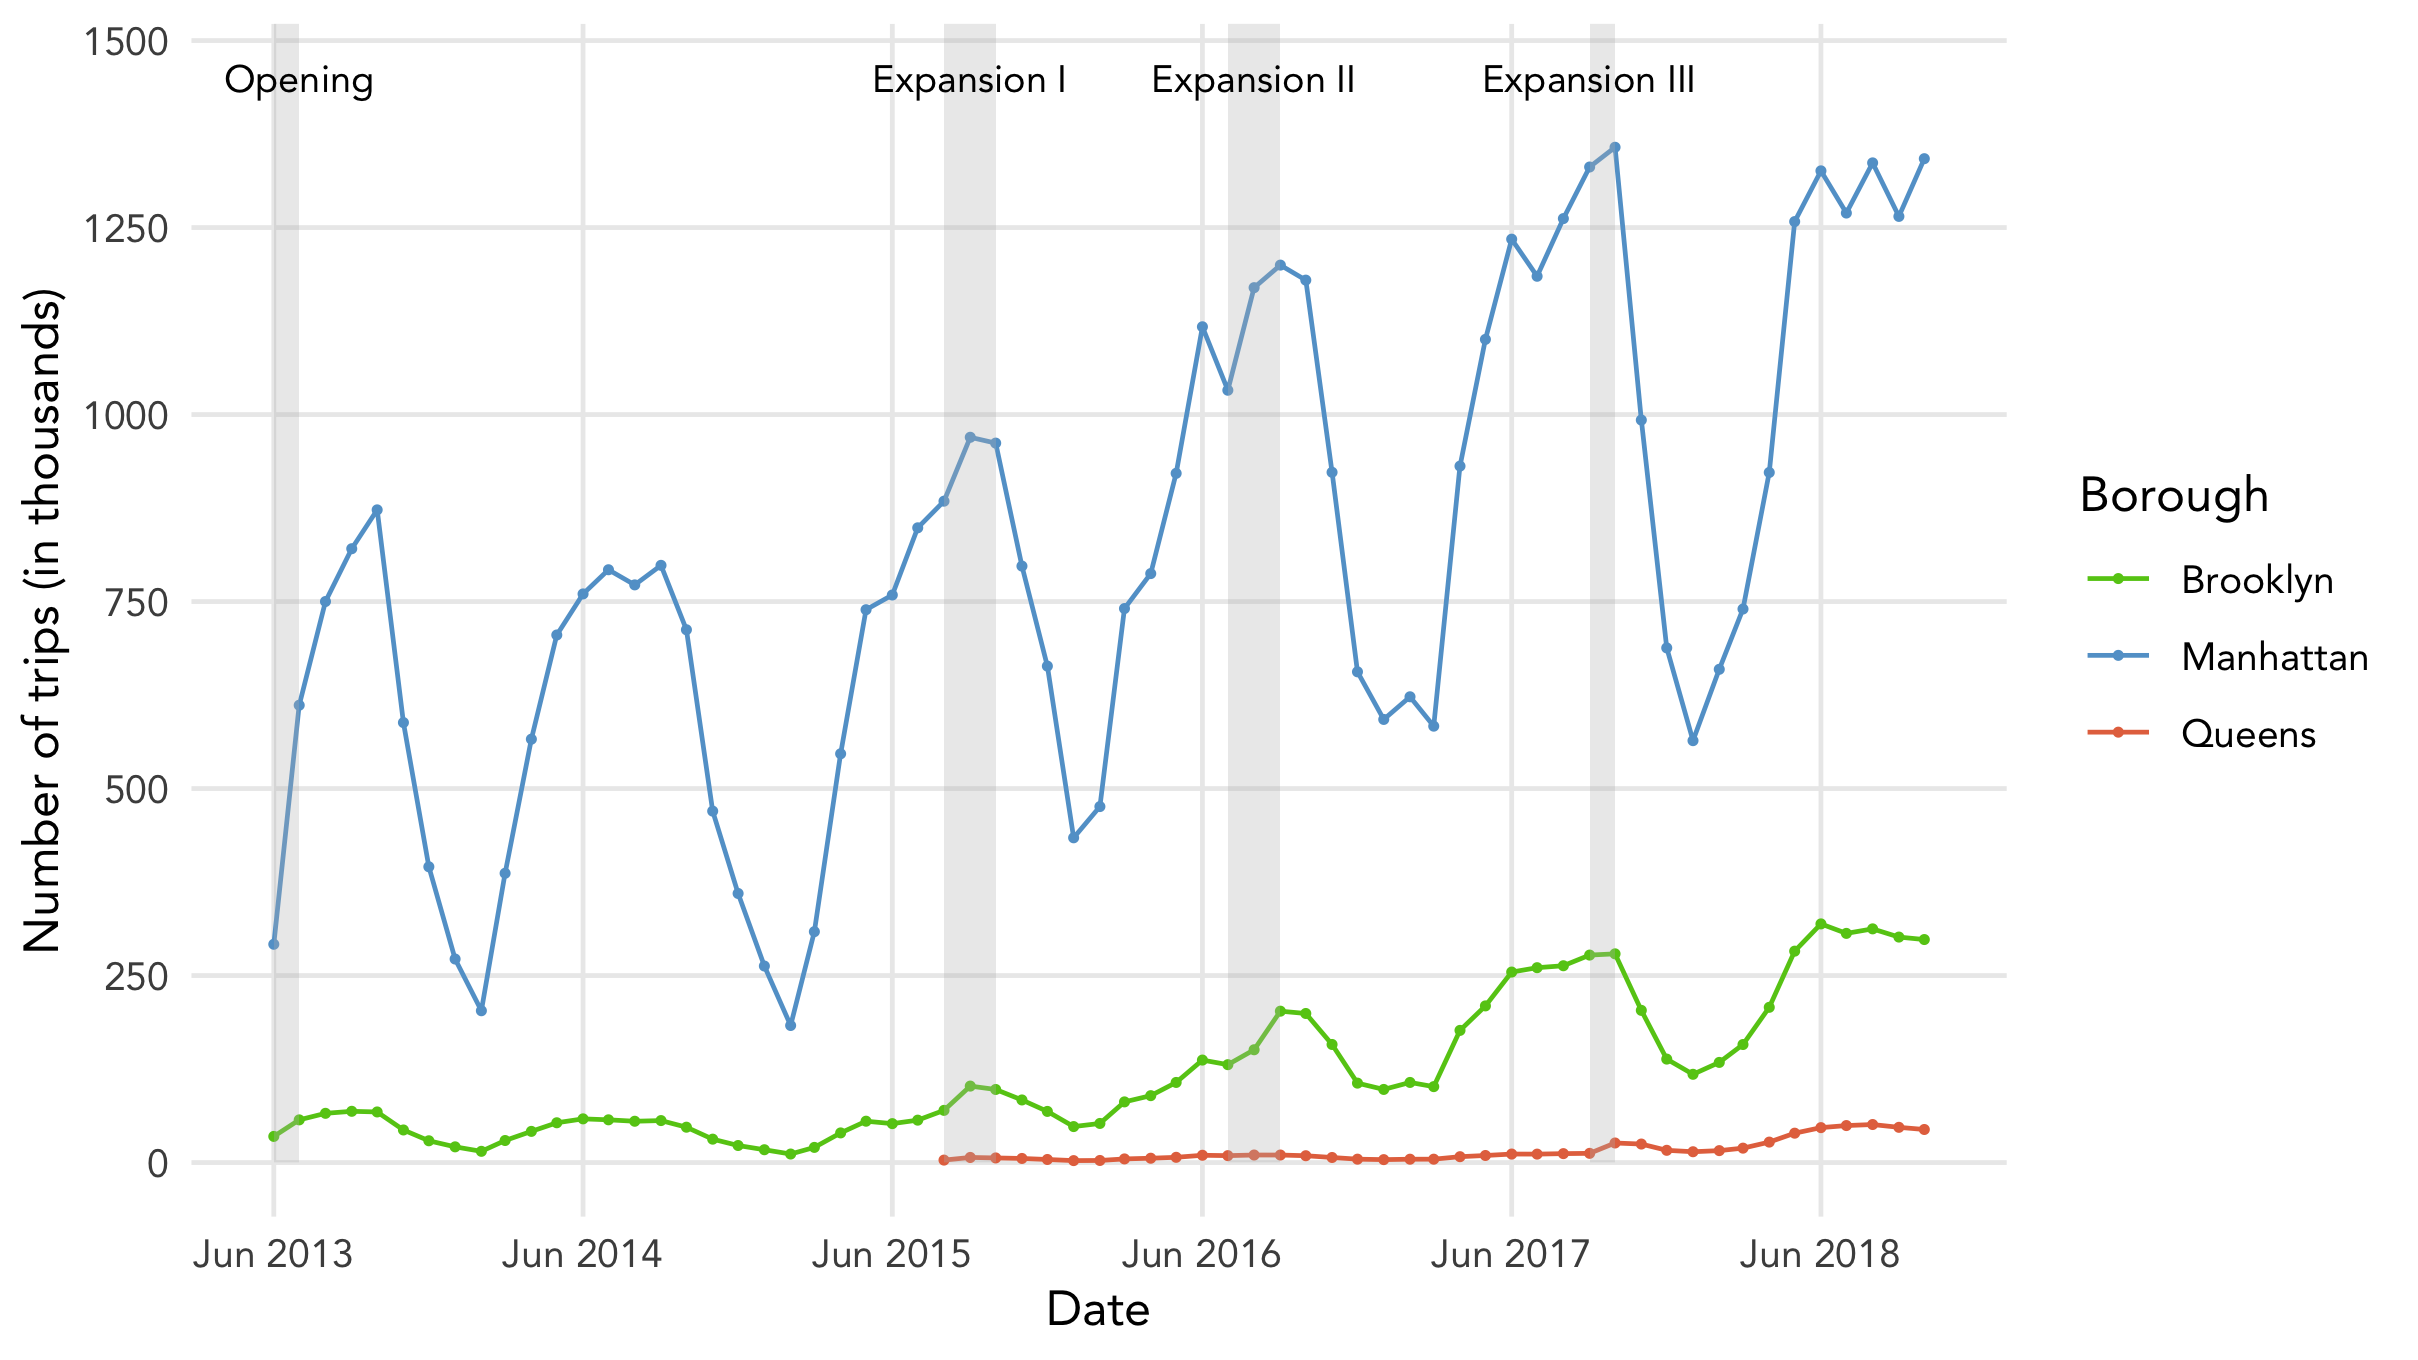
Figure 1 above presents monthly Citi Bike trip counts since its inception in June 2013, differentiated by borough. I also highlighted periods when Citi Bike expanded the number of stations in its network to provide some context to the data. There are several interesting observations to gleam from this plot, such as the seasonality of Citi Bike usage, but I would like to focus on one specific point.
Looking at the plot closely, one can see that the late-summer peaks in Citi Bike usage increase only if there was a significant expansion in the Citi Bike network in the previous year. This effect is evident in the 2016 and 2017 cycles, although it is muted for the 2018 cycle as the third expansion was smaller than the previous two. With this in mind, the expansion of Citi Bike’s network appears critical to its long-term growth prospects.
This may seem obvious from a business standpoint, but it actually presents a tough sustainability challenge. One important source of growth for Citi Bike is convincing more people to swap over from other modes of transportation for their daily commutes. This would promote greater usage of the Citi Bike infrastructure and thus improve trip generation in the network. However, if this were true, then the data should highlight increases in Citi Bike usage in the 2014 and 2018 cycles, which it doesn’t.
To answer this question, I sought a different angle. Instead of focusing on ridership numbers, it seemed more useful to track the number of active Citi Bike annual members instead. I collected this data manually from Citi Bike’s monthly operating reports.
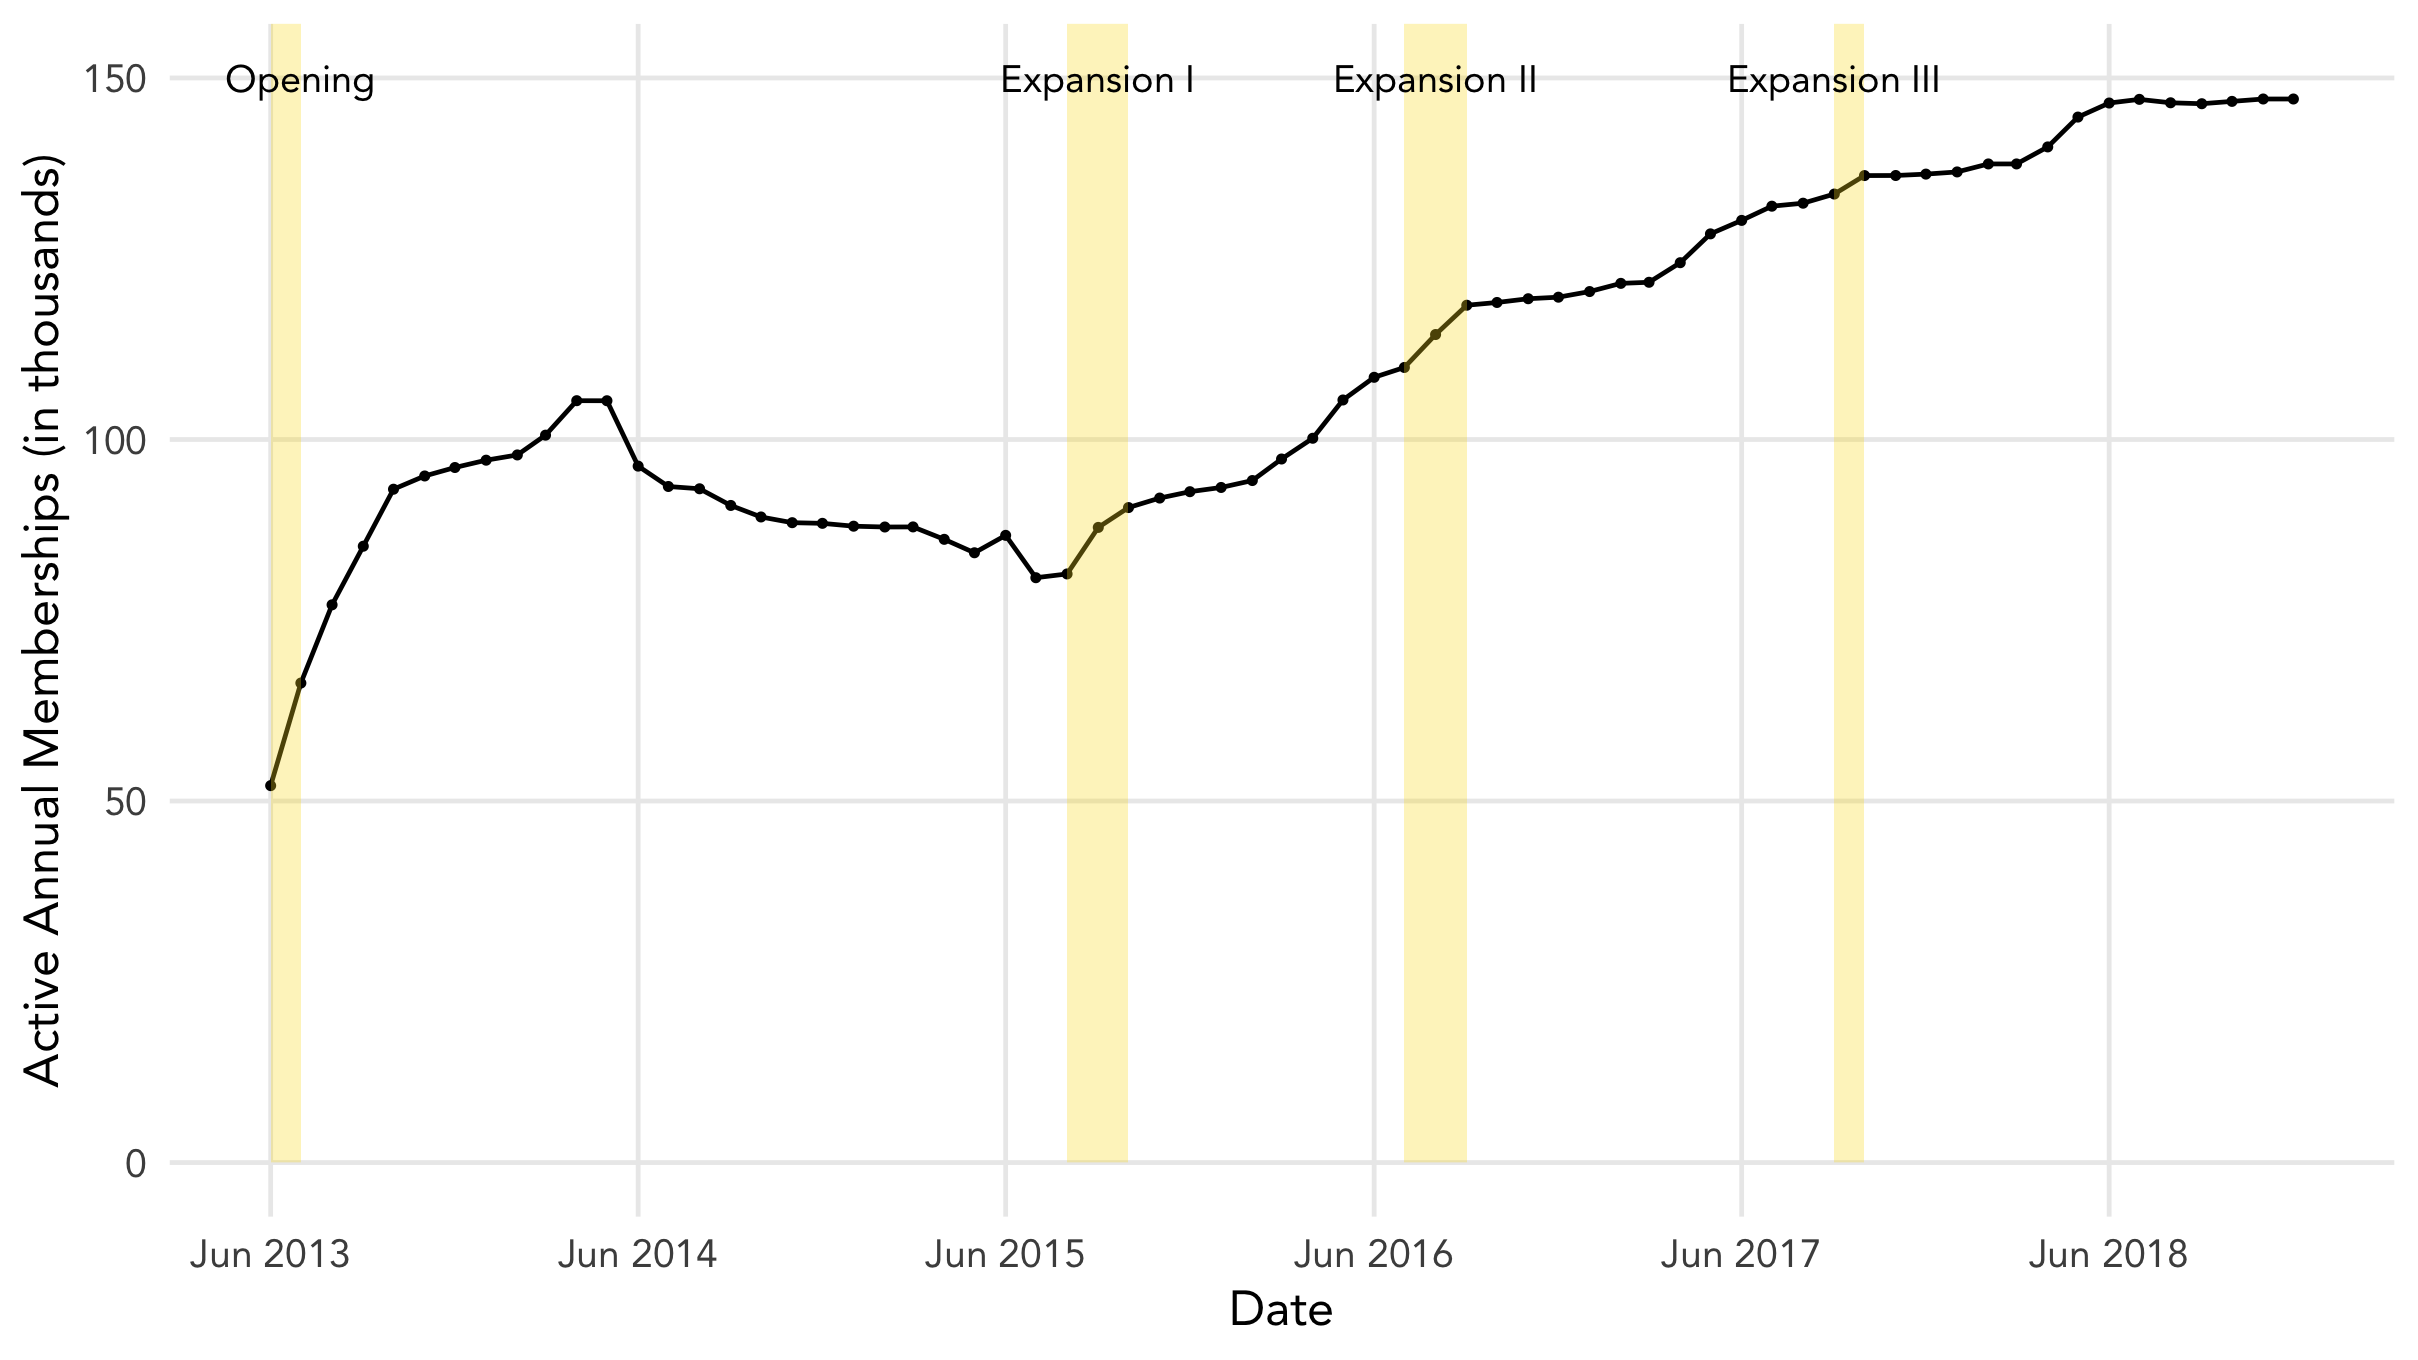
Figure 2 shows a very important part of the Citi Bike story that is often overlooked (mostly because the data is not readily available) - subscribers are ultimately what drive ridership numbers. Focusing purely on the number of Citi Bike trips misses half the picture and fails to recognise that membership fees are Citi Bike’s revenue source, not per-trip fees.
Looking at the data, Citi Bike started strongly in 2013, nearly doubling their June number by the year’s end. However, 2014 marked a period of stagnation and gradual decline, presumably because many people let their annual memberships expire without renewing them. This was reversed in August 2015 with the extensive expansion of the Citi Bike network, which set membership numbers on an upwards trend that has persisted till today. Notably, the largest swells in membership numbers come right before the summer or during the expansion periods.
In many ways, Figure 2 validates Lyft’s decision to aggressively expand Citi Bike’s coverage area. Each expansion brings in more subscribers, not just immediately but also in the long-run. For example, although there was no significant expansion of Citi Bike’s station network in 2018, there was still a sizeable bump in annual memberships in the spring months leading up to June. Add the fact that dockless bicycle sharing operators have begun operating in the Bronx, Queens, and Staten Island, along with the exclusivity clause included in Lyft’s agreement with the city, and it is clear that a big part of Lyft’s motivation in this expansion is to stymie entry by potential competitors. The battle for subscribers is now underfoot.
2. Trip durations and frequencies
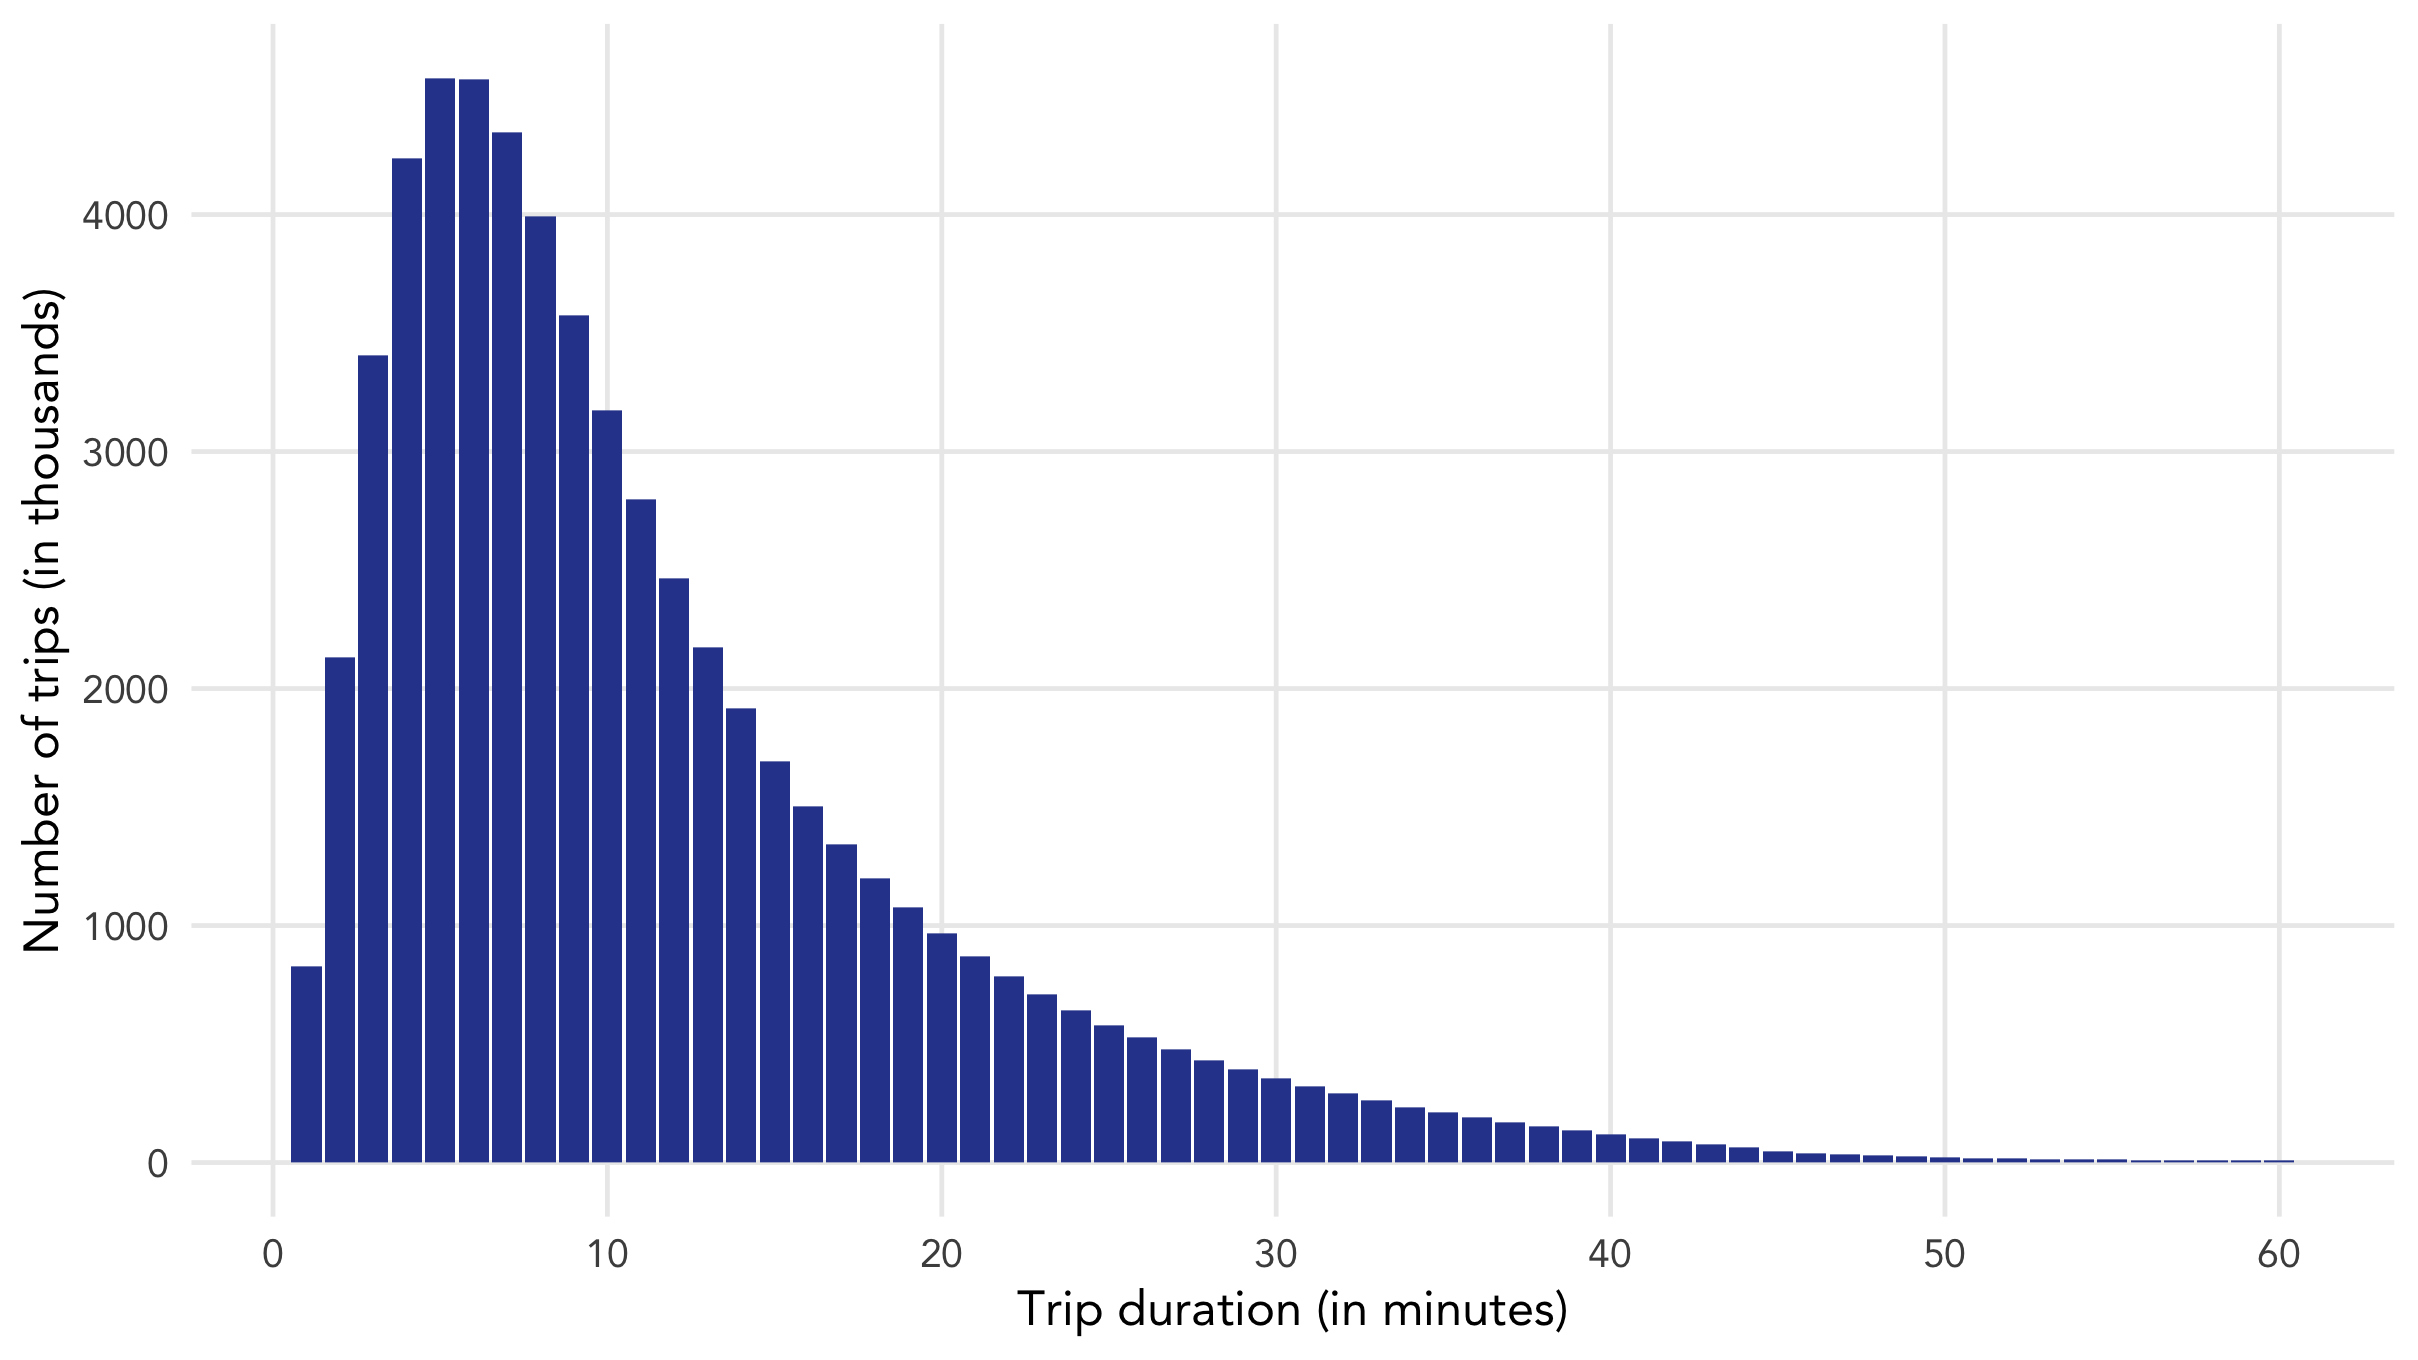
Unsurprisingly, Figure 3 shows that most Citi Bike trips are completed within 20 minutes, with very few taking longer than 45 minutes. Part of this is because Citi Bike has deliberately incentivised the use of its bicycles as a public transportation option rather than as a leisurely activity through an implicit limit of 45 minutes for each ride. This also reflects the use of Citi Bikes as a complementary mode to the existing public transportation network (a topic I explored in a previous post), serving primarily as a last-mile option and not as a direct competitor to the subway system.
The use of Citi Bike as part of the daily work commute is also evident when we look at trip frequencies throughout the day.
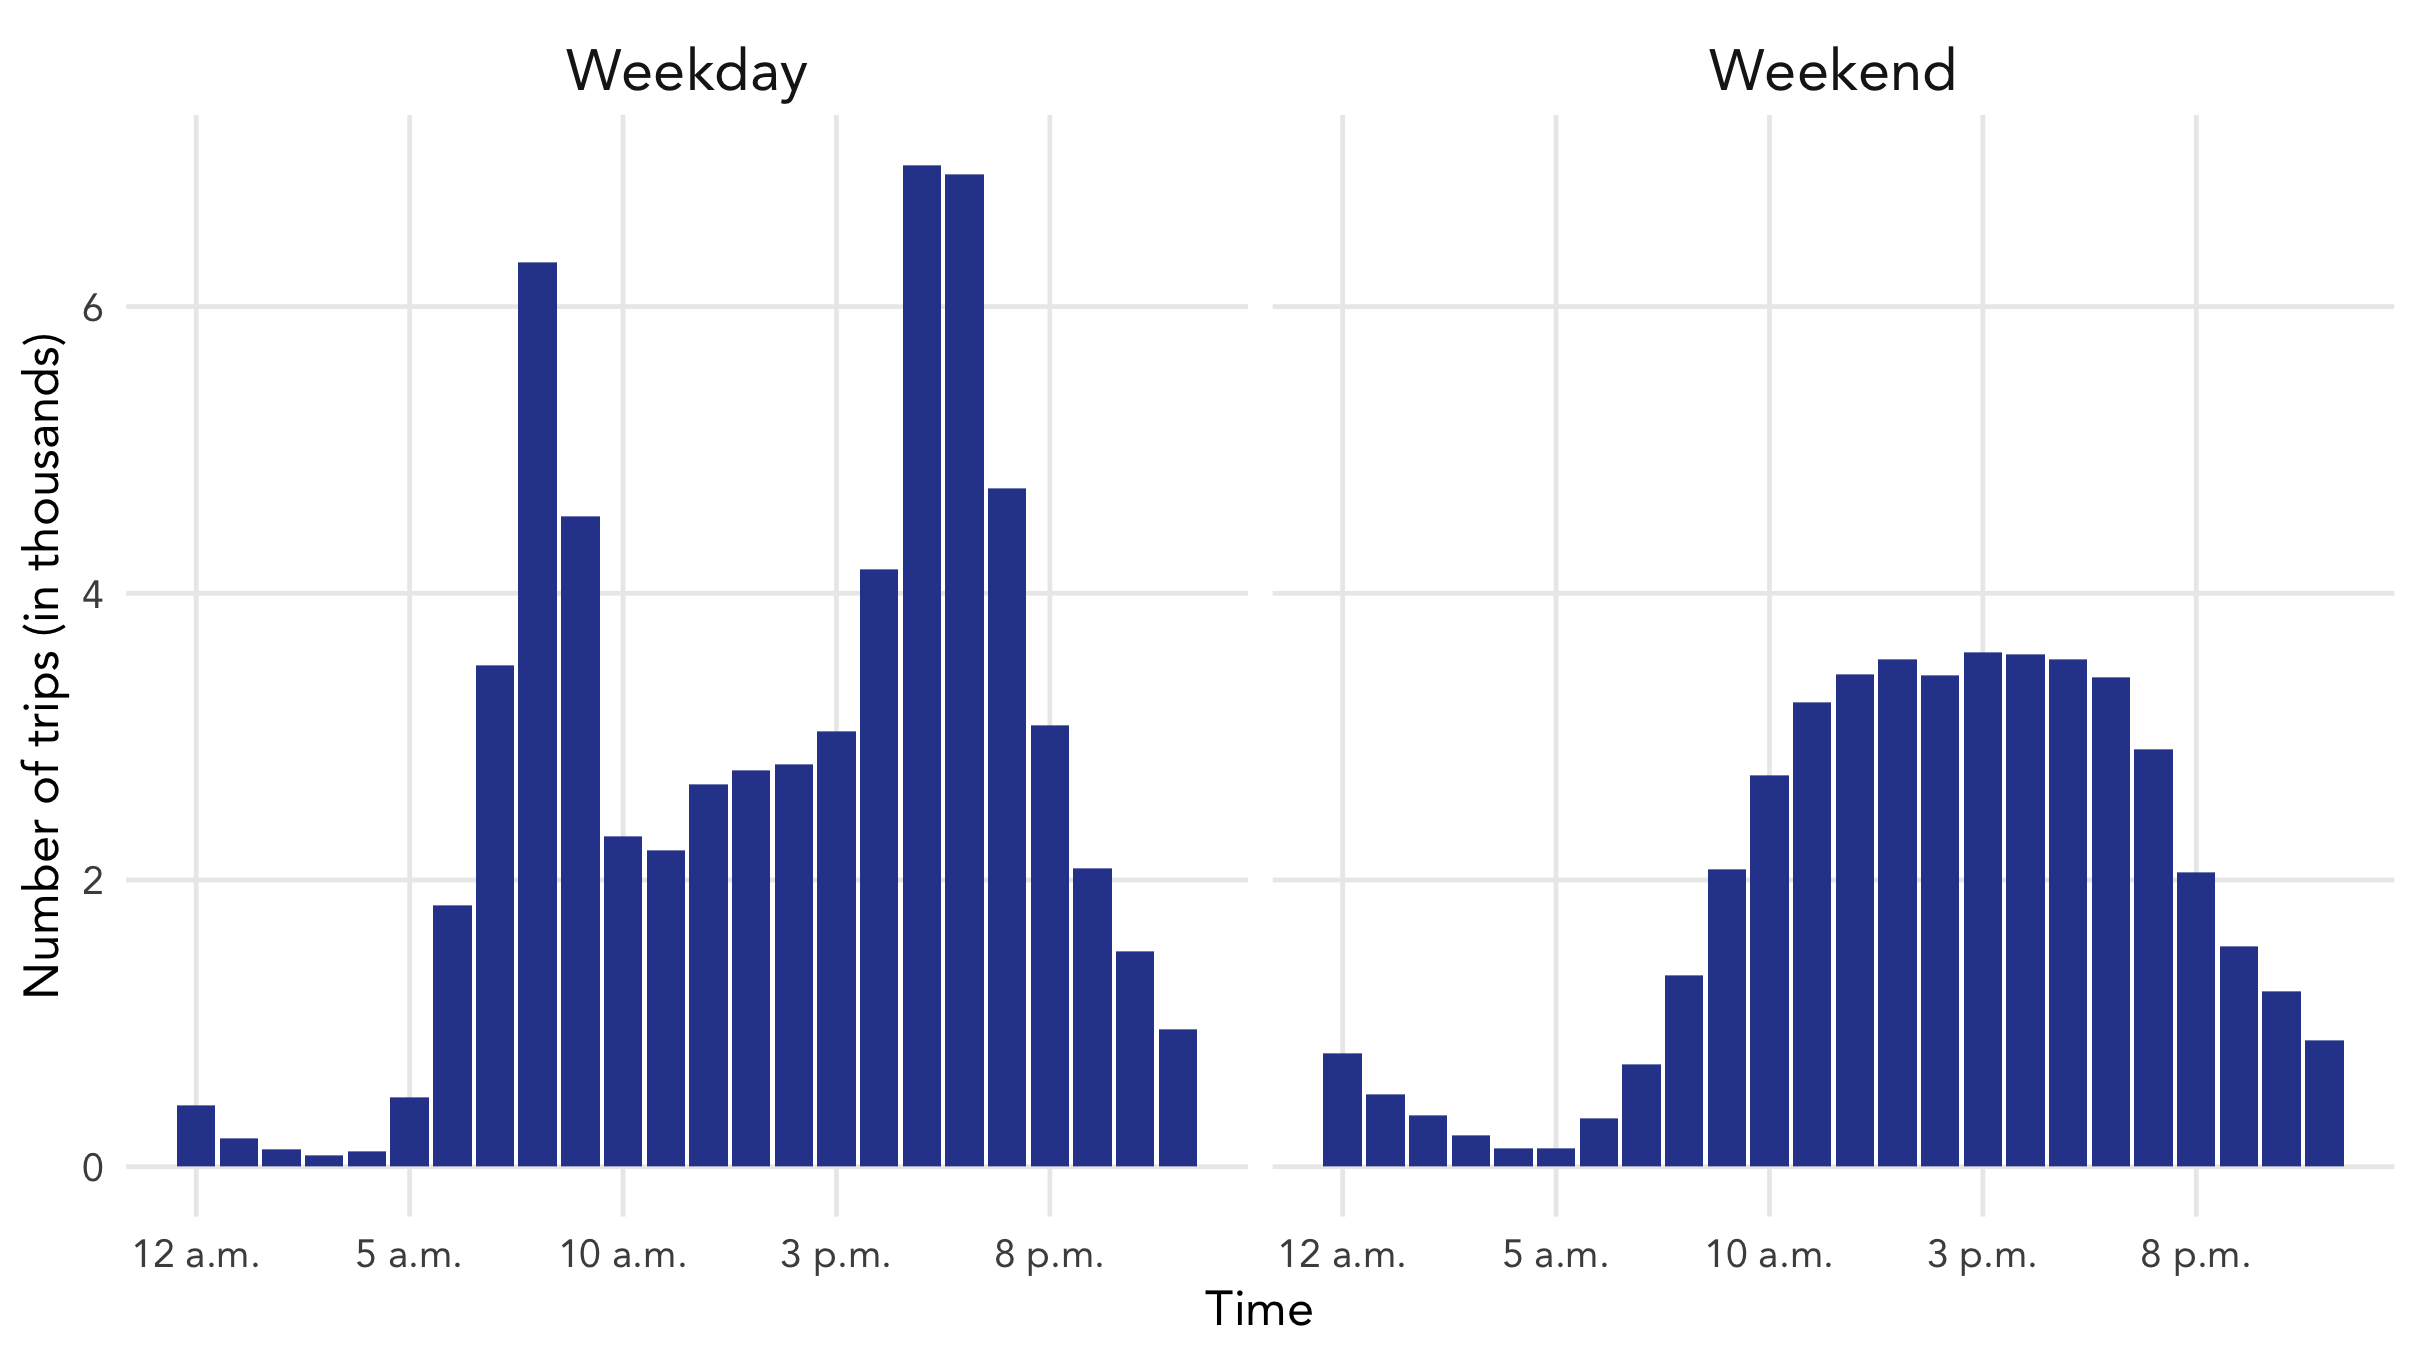
Figure 4 presents the average number of Citi Bike trips made by each hour of the day, differentiated by weekday or weekend, using trip data from a randomly selected week (20 August 2018 to 26 August 2018). Weekday trips feature two sharp peaks which coincide with the morning and evening rush hours, while weekend trips have a smoother distribution that plateaus in the late afternoon.
Although Citi Bike has been largely successful in encouraging the use of its bicycles as part of a multi-modal commute, one serious challenge they face is in rebalancing the bicycles across the docking stations. Last-mile journeys during the rush hours tend to be uni-directional - most commuters are either headed to or from the nearest subway station. However, there is only a limited number of docks available at each Citi Bike station, especially in areas where space is scarce. Without substantial intervention, this will constrain the number of trips that subscribers can take on the Citi Bike network, and will frustrate commuters who cannot find a bicycle for their commutes.
Many articles and studies have devoted themselves to this problem and so I won’t go into further detail here, but it is worth pointing out that this problem will only be exacerbated as Citi Bike expands deeper into the residential areas of Brooklyn and Queens where the uni-directionality of last-mile journeys are most pronounced.
3. Temperature and rain
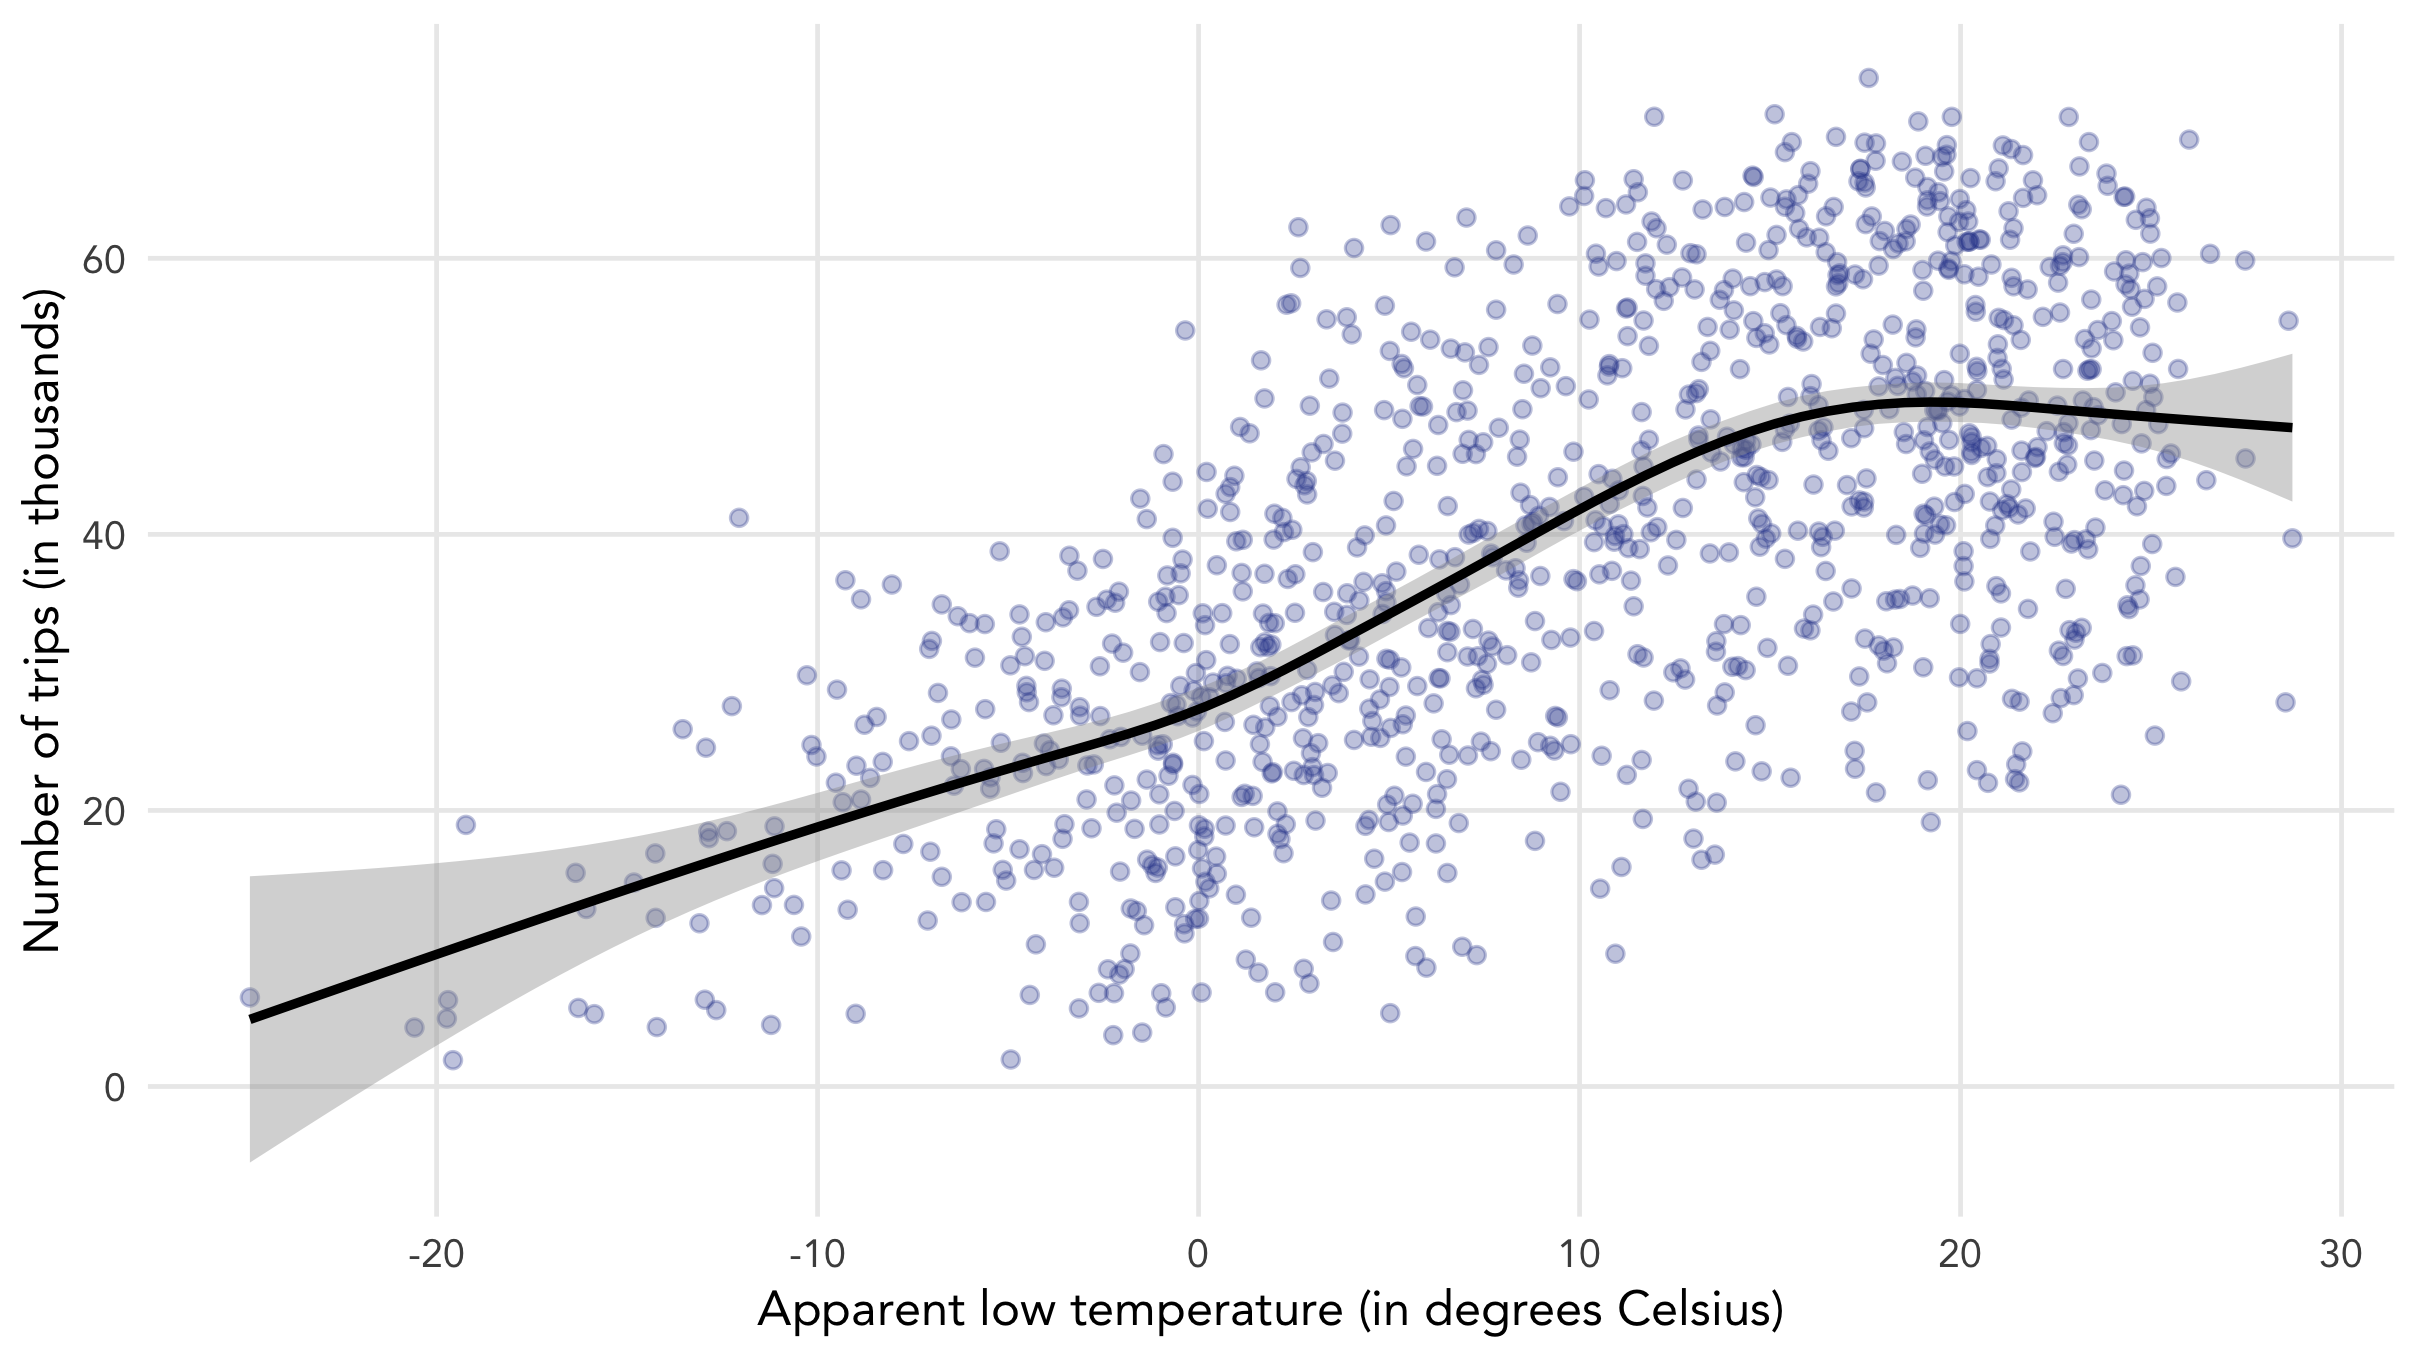
Figure 5 is a scatter plot of the number of Citi Bike trips against the apparent low temperature for each day since Citi Bike began its operations in June 2013. The black line indicates the smoothed conditional means based on the data, with the grey area representing the confidence interval (for more details about this, have a look at the documentation here).
The plot shows a clear positive relationship between the temperature and the number of Citi Bike trips, which is expected since cycling is an outdoor activity and is far less appealing during the winter months. The difference is stark: there are almost twice as many trips when the temperature is a breezy 20 degree Celsius as compared to a frosty 0 degrees Celsius.
Perhaps what matters more, however, is precipitation. After all, cycling through a drizzle is never an exciting prospect.
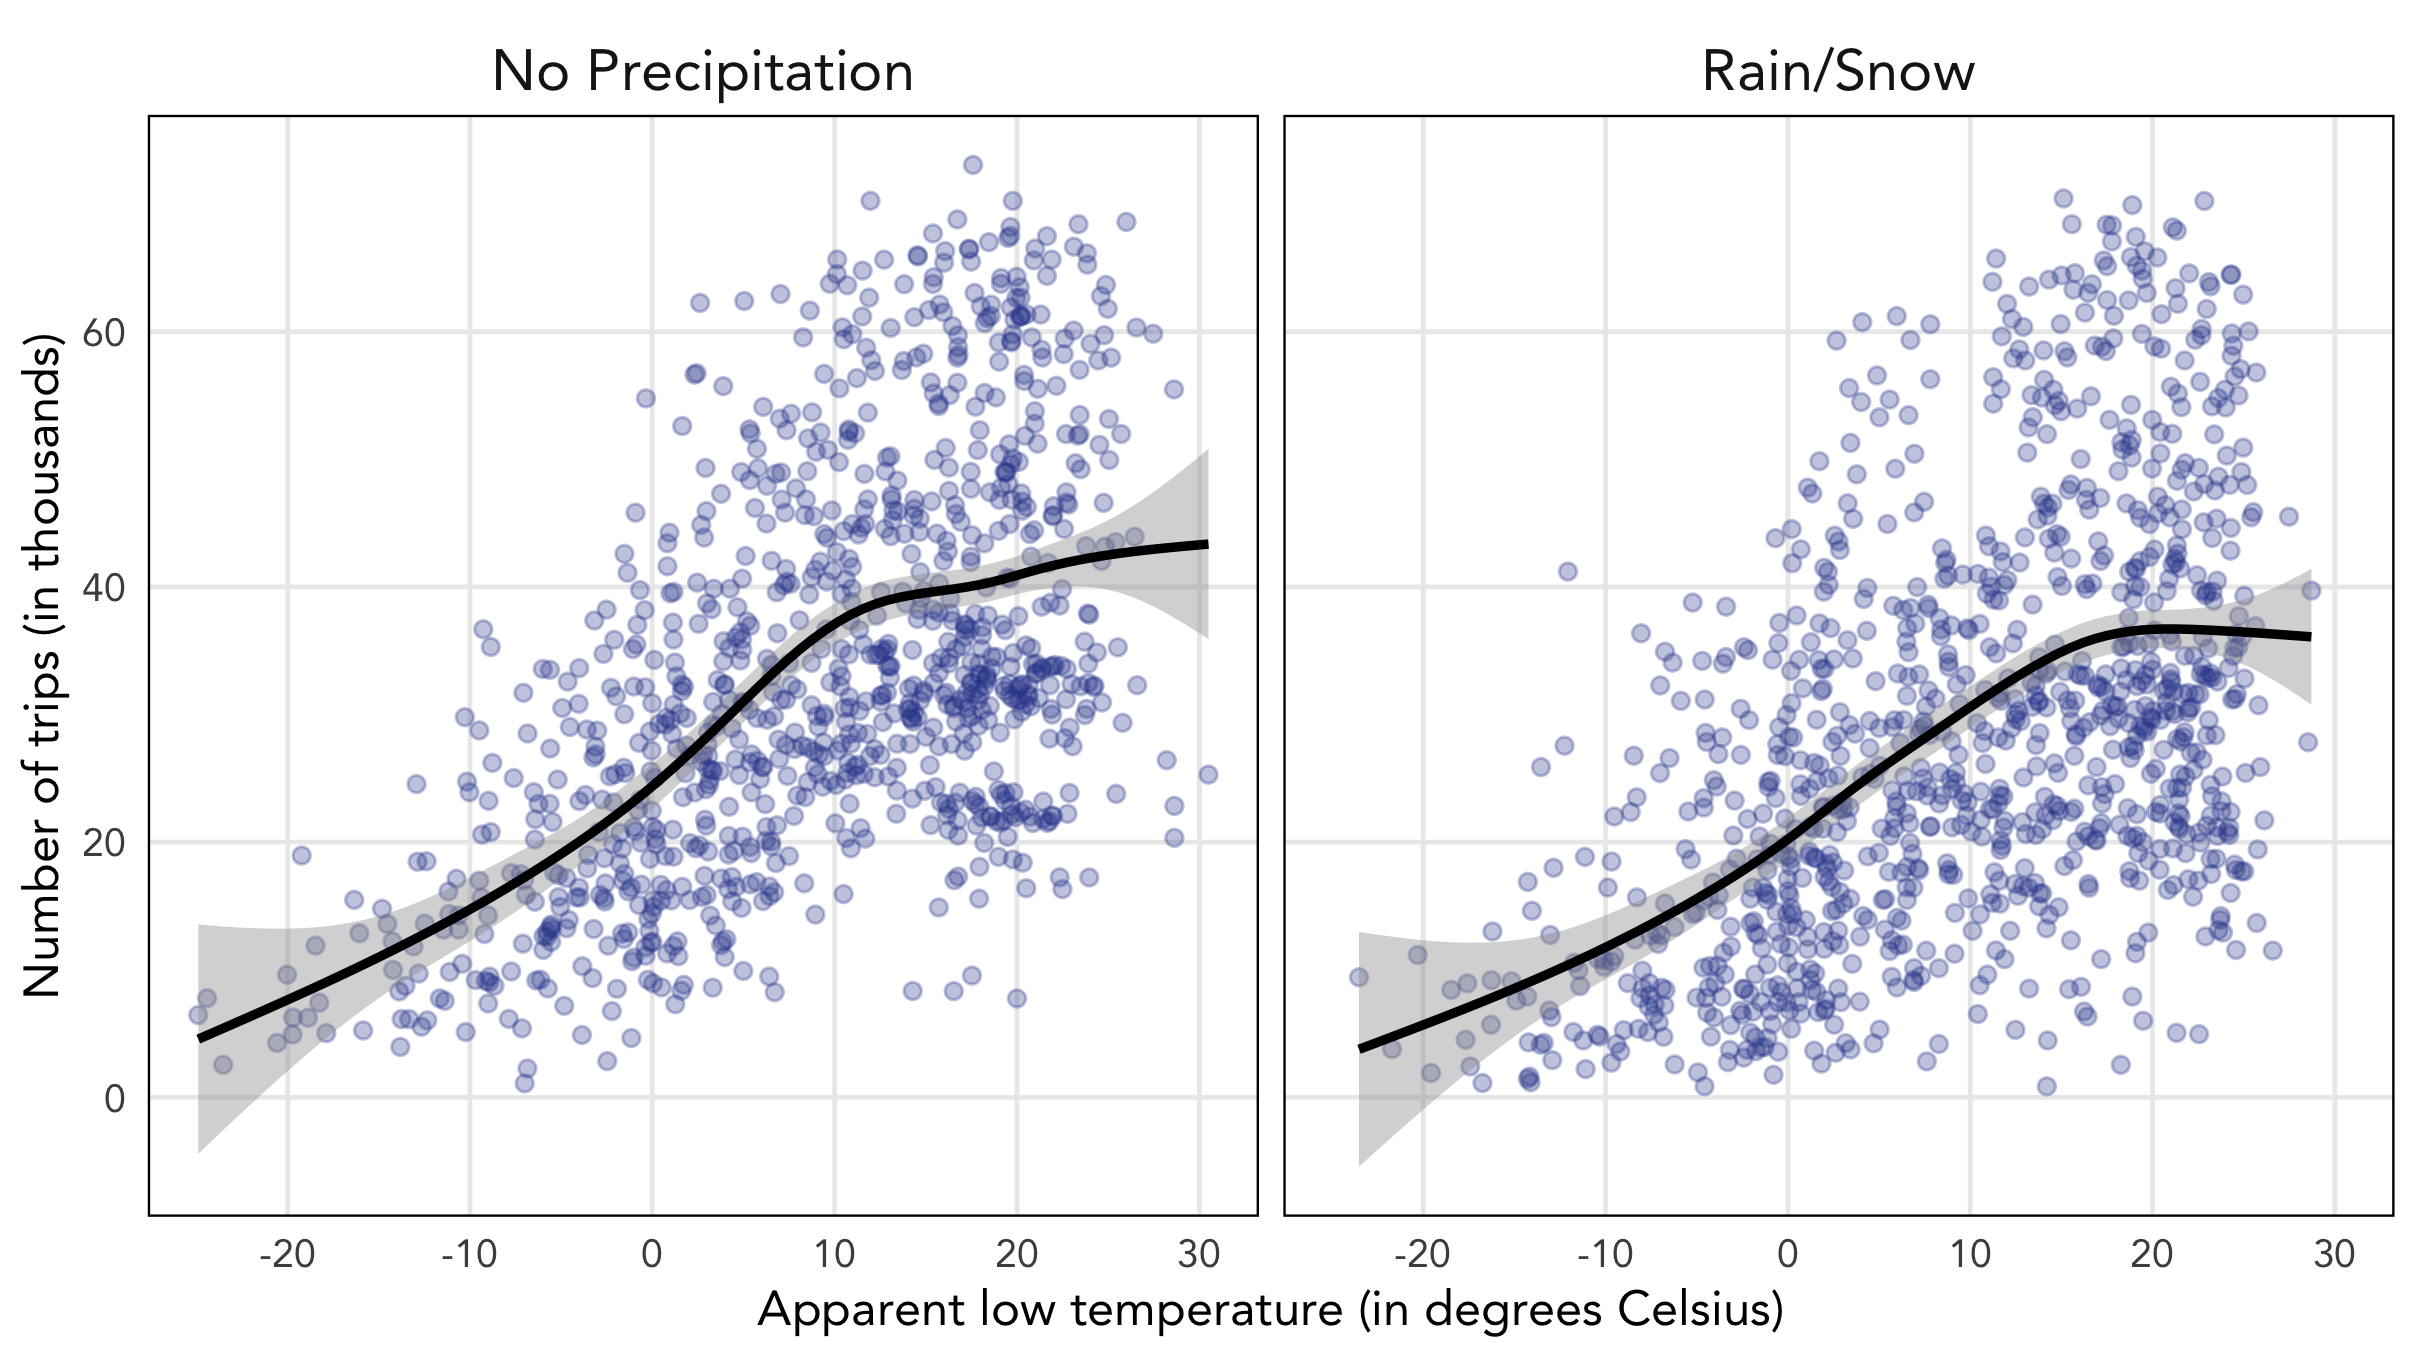
In Figure 6, I repeat the same scatter plot but split the data into days with no precipitation and days with some rain or snow. This gives us a better idea of the interaction of precipitation with temperature on Citi Bike ridership. Expectedly, precipitation lowers ridership levels at every temperature, although the effect is more pronounced in the warmer temperatures.
By itself, these plots don’t tell us much about potential challenges that Citi Bike may face in expanding its network, but it may be worth looking at the frequency of specific trips that are clearly last-mile journeys and whether they are less affected by changes in temperature or precipitation.
4. Bicycle counts
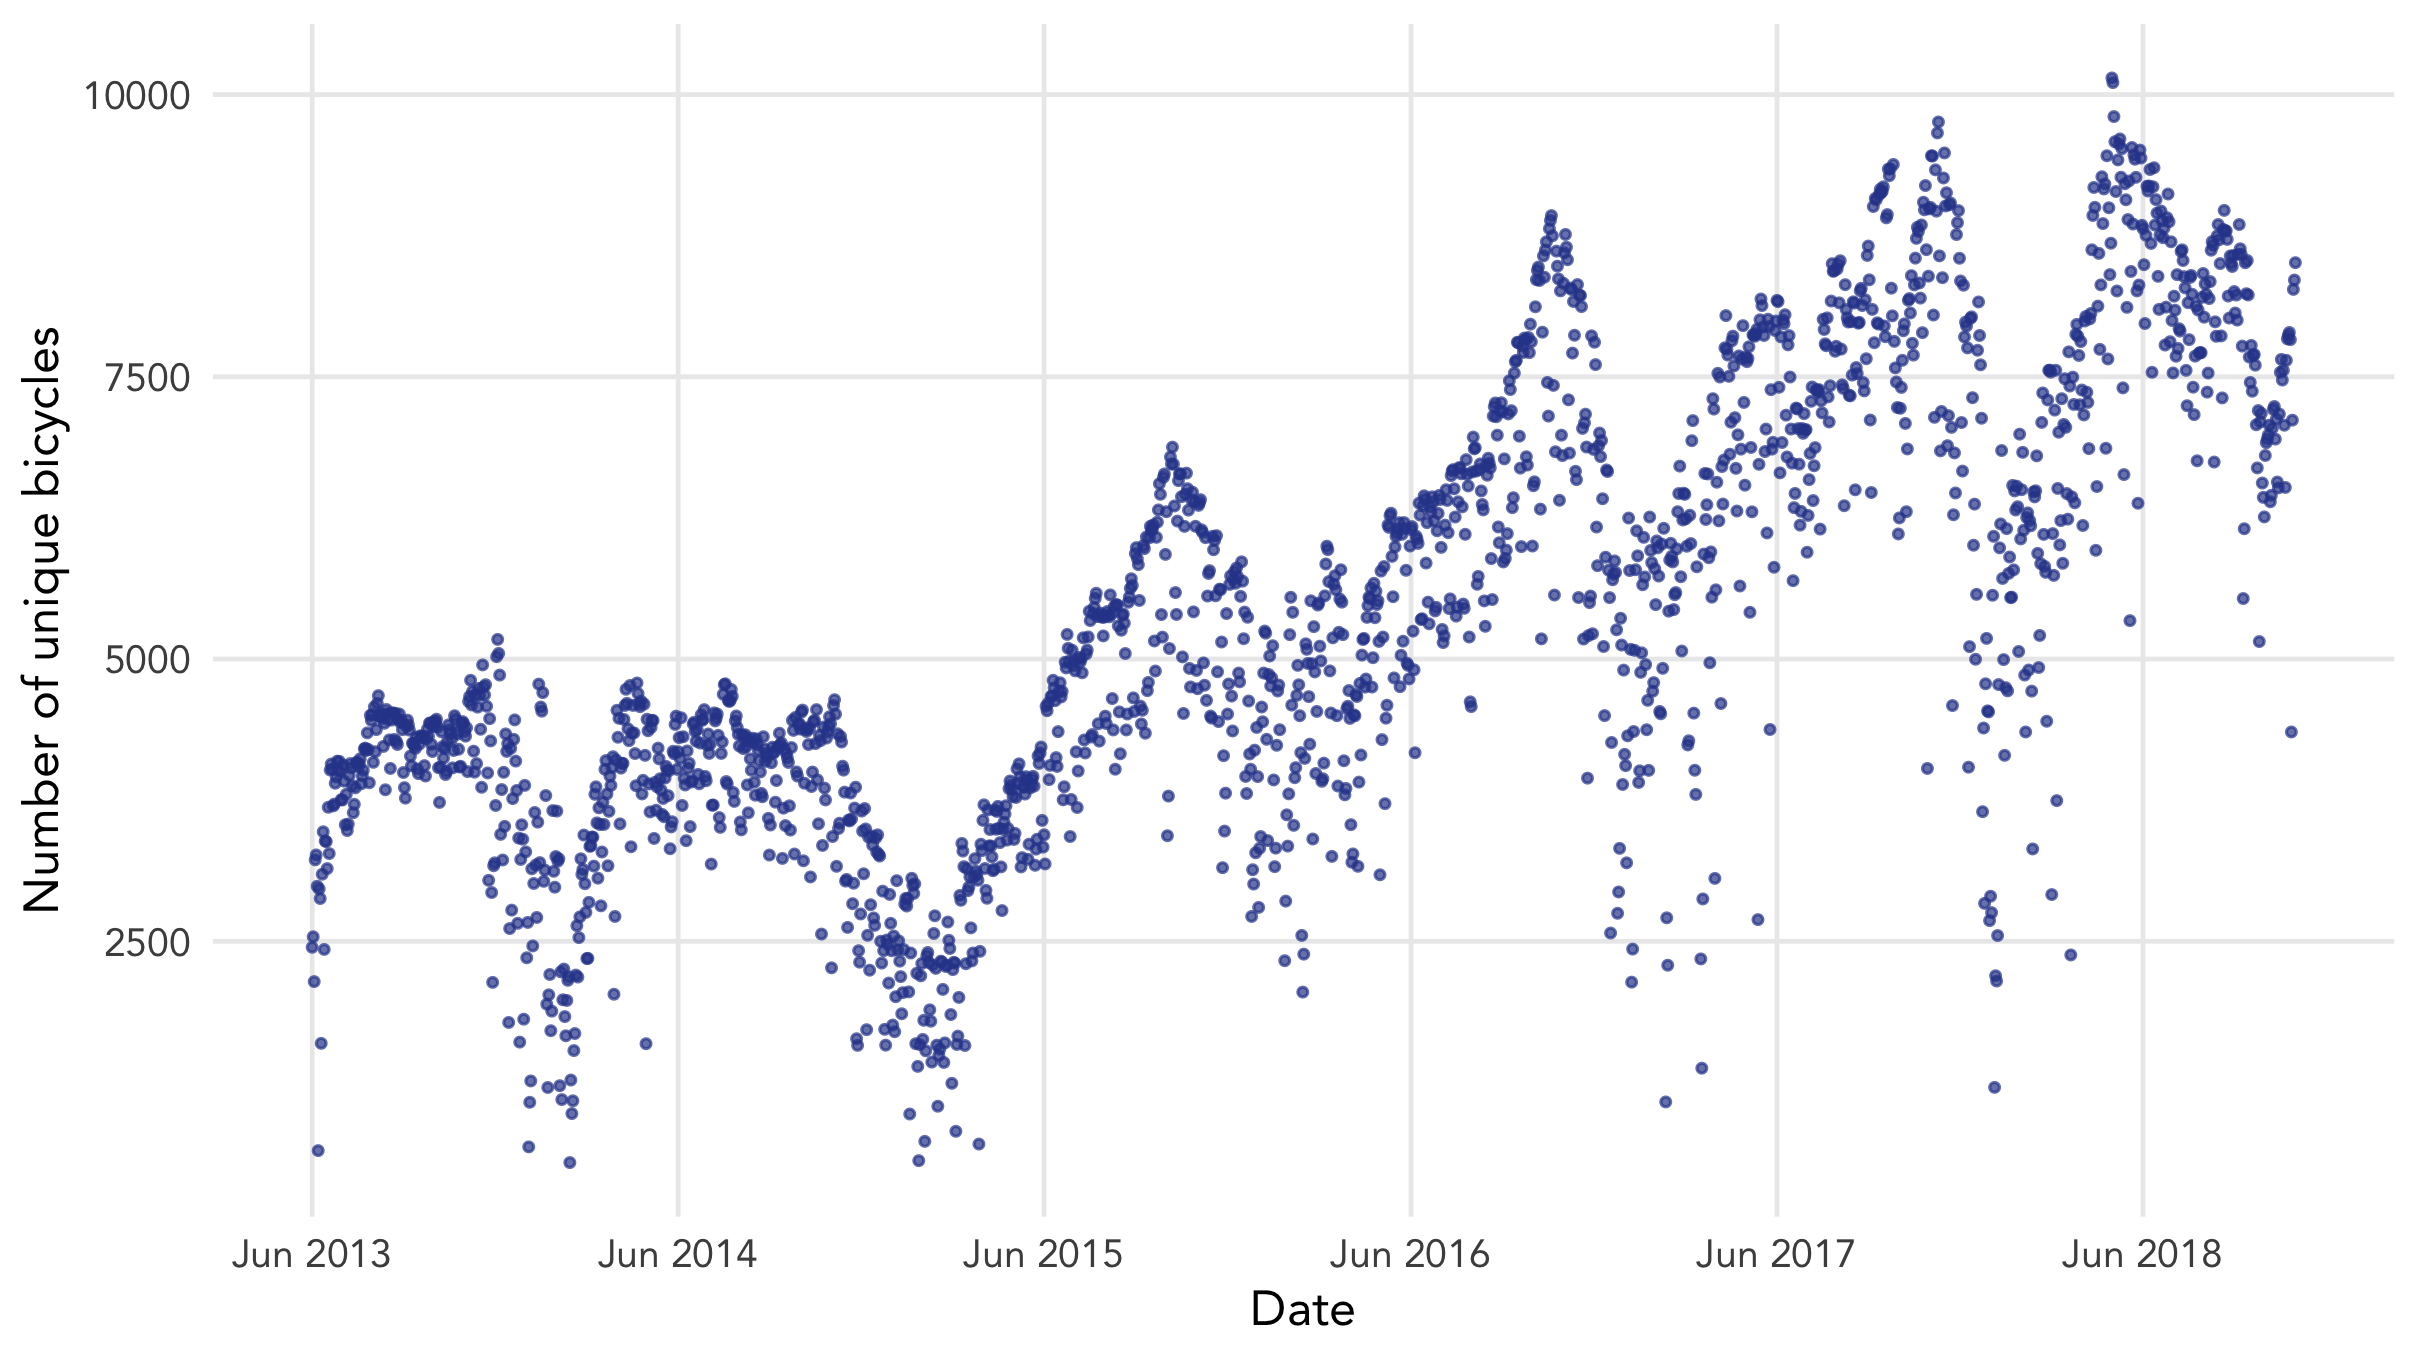
This section was inspired by two things: the bike_id variable in the trip data and Lyft’s goal of tripling the number of Citi Bikes. Few people have analysed the bicycles themselves within the network, mostly because there aren’t a lot of insights to gleam from it. Figure 7 shows the number of unique Citi Bikes used each day, which closely mirrors the seasonal pattern of usage which we explored in an earlier section.
One observation worth pointing out here is that the number of unique Citi Bikes used has only doubled since its inception in 2013. Citi Bike officially puts the number of bikes at 12,000, but the actual usage appears to peak at around 10,000 at best. Figure 8 makes it clear how ambitious Lyft’s goal really is - a tripling of the bicycle fleet would be an unprecedented move and a serious upgrade over the current growth in bicycles since Citi Bike’s inception. However, Citi Bike’s problems with fleet maintenance are well-documented, and these issues will only become tougher to deal with as Citi Bike’s fleet of bicycles grows and ages.
Instead of just focusing on the number of unique bicycles used every day, I also looked at how often each bicycle was used every day.
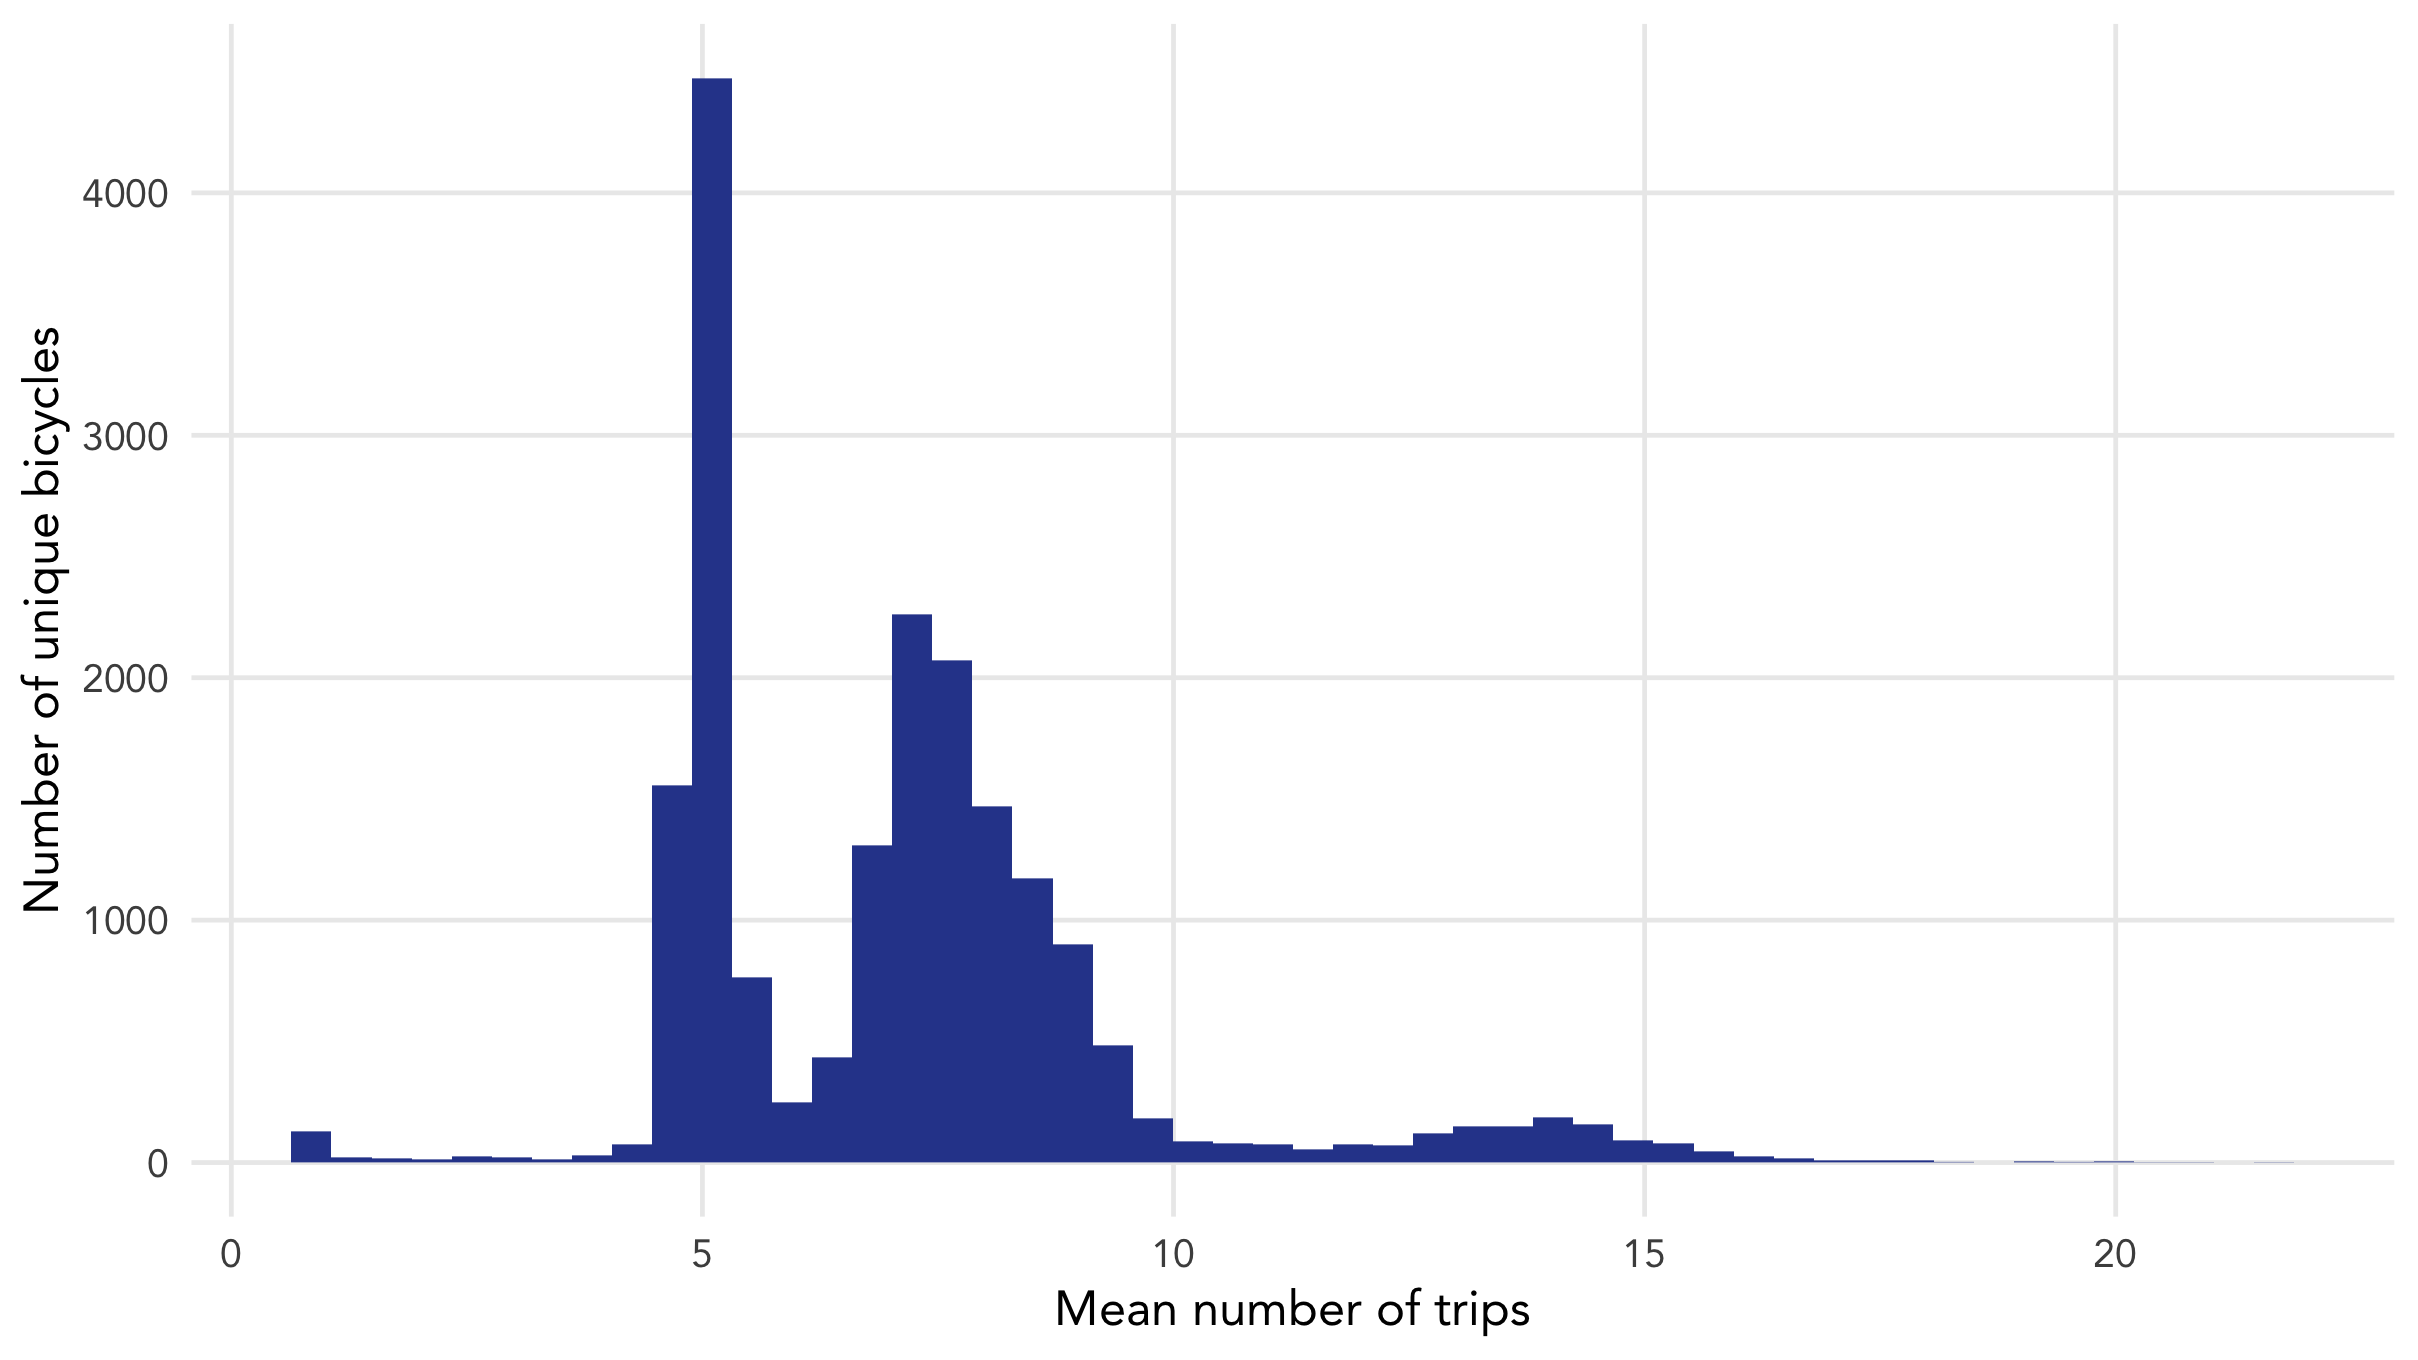
Figure 8 presents a distribution in the average daily usage of each Citi Bike. Most bicycles are used for 5 to 10 trips daily, with two peaks - one at around 5 and another at around 7. This is most likely because majority of the bicycles are located in Manhattan, where Citi Bike trips start and end at relatively populated areas. As Citi Bike expands deeper into residential areas of Brooklyn and Queens, one challenge will be coping with the less frequent use of bicycles, and thus a smaller return on each bicycle.
Conclusions
Citi Bike has performed remarkably since it first began operations, and this planned expansion marks a watershed moment for the largest bicycle sharing system in the United States as it looks to establish itself as an integral part of the city’s transportation network.
This post examined various aspects of Citi Bike’s performance thus far, and highlighted some potential areas of concern along the way. In the next post, I’ll be looking at Citi Bike’s current business strategy and how that may have to change to cater to the new demands and constraints that such an ambitious expansion will bring.